

#Dashboard #KPI #SocialMedia
After looking at 'How to constuct your KPIs' and discussing the 'Top 20' for your Social Media ROI, we're now going to look at how to create social media KPI dashboards.
Here we will speak about real-time, editable and customizable dynamic dashboards.
1. Which indicators should you use?
The dashboards must feature a minimum of 2 or 3 of your priority KPIs (ideally those which are based on your objectives).
They must be able to feature a global view and one or more specific views, filtered according to a more refined criterion. For example: The global view might show the KPI "Number of Twitter mentions of your brand" and then within a specific view - Twitter KPIs of a region, city, feeling (tone) or subcategory of the brand (segment, model, product).
Dashboards must also display your secondary KPIs: 5, 10, 15 or more: those which are not used to calculate the achievement of your goals, but that are closely related or are important in terms of analyzing your digital activity and understanding all the data throughout your social media marketing funnel process.
2. How should you organize your Social Media KPI dashboards?
Like any dashboard, the data retrieval logic can monitor different types of, in this case, social media metrics.
a. Social Media dashboard organized by channel type:
- Paid search: here is where the KPIs linked with your Ads are grouped: Twitter, Facebook, LinkedIn and Instagram Ads.
- Earned media : view the KPIs corresponding to media and web conversations which talk about your brand, categorized under social network and support: Twitter, Instagram, LinkedIN, blogs, forums, etc.
- Owned media: This table displays the KPIs that measure the performance of your own social networks. Eg. your Instagram community growth, Facebook engagement rate, reach ...
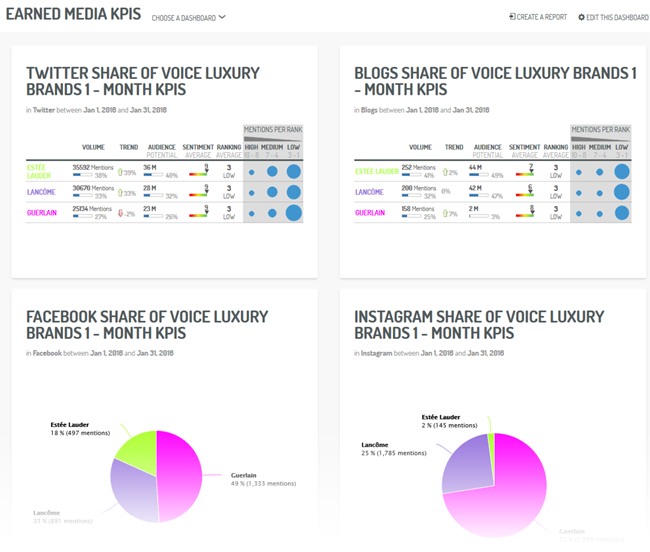 KPI dashboard - Earned Media organized by social media channel and web (via Digimind Social)
The tables in this dashboard can then be broken down by period (weekly, monthly or by a specific date related to a marketing action) and customized by region, product.
b. Dashboard organized according to your social media marketing funnel phases:
Example: Brand Awareness > Customer Acquisition > Engagement > Customer Satisfaction > Lead Conversion
Thus, each dashboard tab corresponds to a phase, displaying within it grouped tabs organized by channel, product or geographical area.
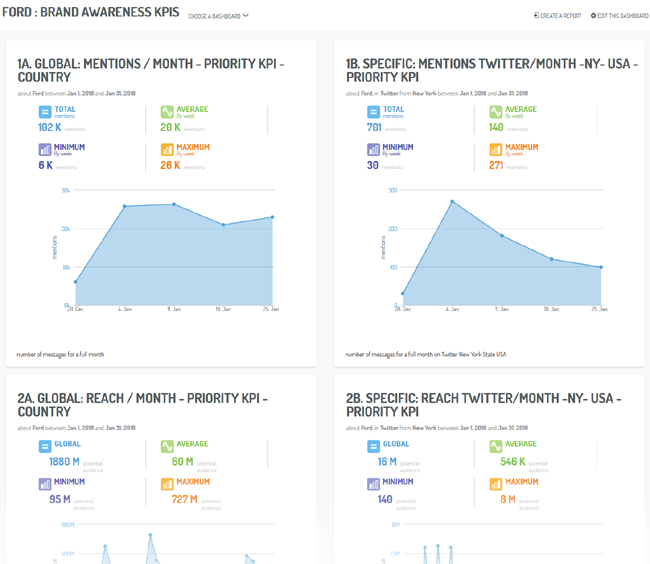 A KPI dashboard for the 'Brand Awareness' phase: global view refined to New York, on Twitter (via Digimind Social)
c. Synthetic dashboard
This simply shows your priority KPIs and some secondary KPIs within a single view.
d. Market/regional dashboard
Organized according to your geographical locations or by your line of products.
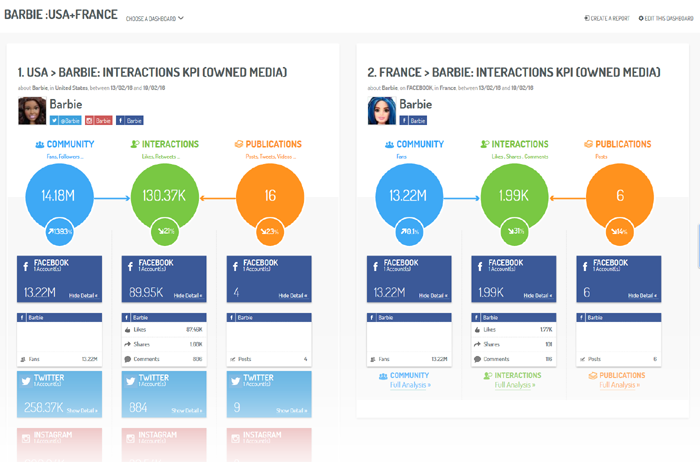 A KPI Markets dashboard, for the Engagement phase - USA and France regions – Owned Media (via Digimind Social)
3. Which type of display should I choose?
It must match the way you work, especially in regard to your logic analysis, reporting and internal customers, who will ultimately be the addressees of your deliverables. Your chosen typology must flow from your organization logic, data retrieval of your service and the board of directors: these are shareable dashboards and will lead to other deliverables (Word reports, PowerPoint presentations). Thus, if it is the organization by product line that dominates in your business, it is this criterion which should be the entry point to your dashboard.
Finally, these Social Media KPI monitoring dashboards must be scalable and take into account the new medias and metrics regularly appearing at the centre of the social media ecosystem.
Interested by the KPIs we’ve mentioned in the article ? Try Digimind Social for free
REPORT: The Top 50 US Universities on Social Media