To track brand performance on social media during campaigns and events, you need a variety of quantitative and qualitative indicators to produce accurate analyses for your management reports. At the same time, it is important to link this periodic report with real-time data via a dynamic dashboard, which will facilitate daily monitoring and understanding of data.
Here we will review 5 essential graphs your social command centres should display as a summary of your brand’s performance in both earned and owned media.
Earned Media
1. Volume of Conversations About Your Brand
Purpose
It is essential to visualize the volume of messages, and peaks in conversations, so as to predict the potential impact digital marketing plans have on specific campaigns. Such analysis should also highlight the effects of consumer buzz and the actions of competitors. The period covered would depend on the type of reporting and campaigns monitored.
What to include?
Understand the volume of conversations about your brand or competitors by monitoring:
- Number of mentions
- Reach
- Number of people who talk about your brand
- Number of interactions (retweets, shares, comments, and likes)
With these indicators, you can have a gauge on the level of brand awareness, brand engagement, and community size.
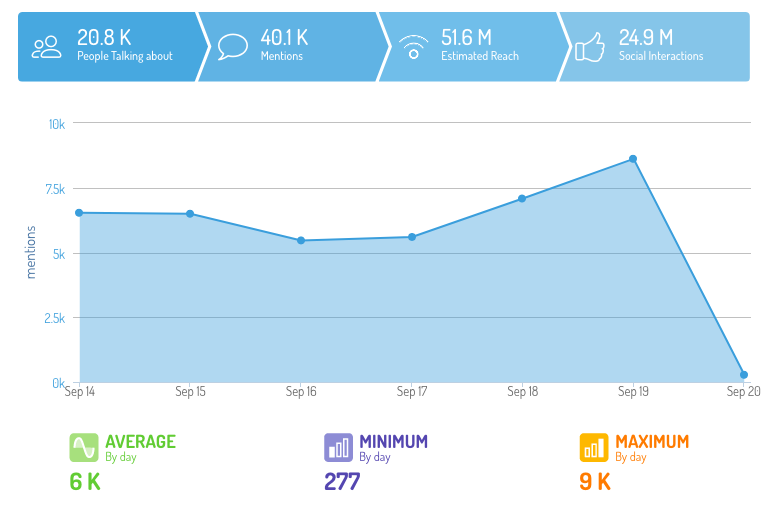 Social listening chart displaying the Volume of brand mentions with indicators of reach, buzz, and interactions
Pro Tip
Showcasing these indicators by number of mentions and reach allow a visual comparison of results, which can highlight interesting scenarios. For example, a small number of mentions that reach a large audience may come from influencers or mainstream media.
2. Share of Voice
Purpose
Measuring your brand’s share of voice against your competitors is one of the most important indicators of brand performance you can derive from earned media. This allows you to benchmark your brand against competitors in the industry.
What to include?
Graphs indicating the total number of mentions each brand has achieved in relation to other monitored brands, will indicate the your brand's share of voice vs. your competitors'.
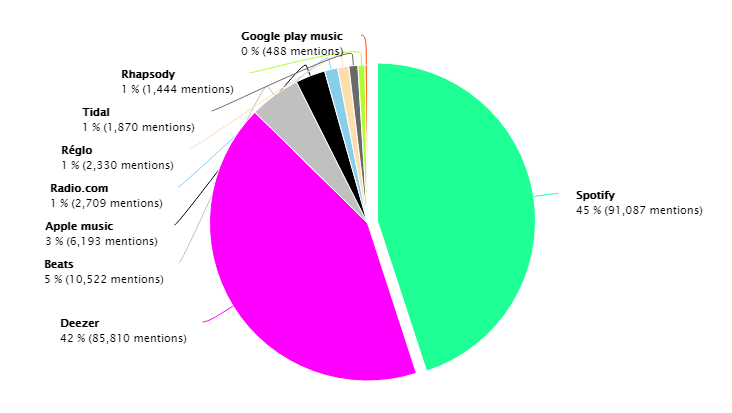 Social listening chart showing the share of voice of players in the music streaming industry.
Pro Tip
Beyond monitoring your brand’s share of voice, charts that report daily brand conversations can help marketers to draw relations between campaigns and consumer engagement. This also helps you gather how much market share you have gained or lost in the industry.
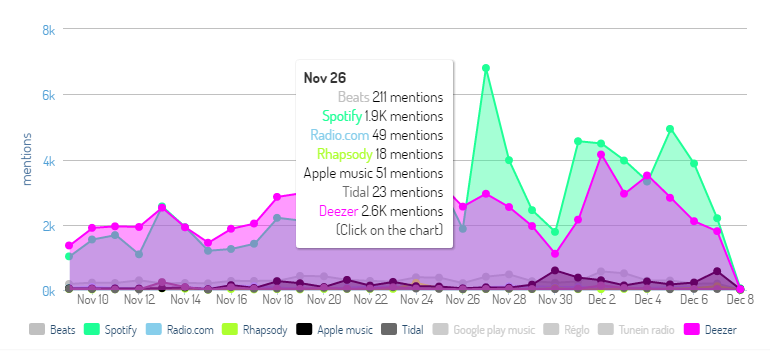 Social listening chart displaying volume of brand related mentions for competitors in the music streaming industry over time.
3. Media Channels
Purpose
In order to make accurate adjustments to your marketing strategy (campaigns, content marketing and targeting), it is essential to understand the types of consumer activity taking place on each social media channel. Within industries, consumers use them differently. For example, a study of fast fashion brands proved Facebook to be a channel that has the highest audience reach, while Instagram has the highest engagement allowing users to discuss prices and services.
This analysis can address two questions: Is your brand present and easily identifiable on these channels to engage internauts and answer their questions? What are the channels favored by your competitors?
What to include?
This analysis shows the following indicators:
- Share of voice per channel by the number of mentions: Determine which channels internauts are more vocal
- Number of mentions about your brand and competitors per channels: Identify if a brand is dominating conversations in a particular channel
- Share of voice of key topics per channel: Understand what customers talk about the most on each channel
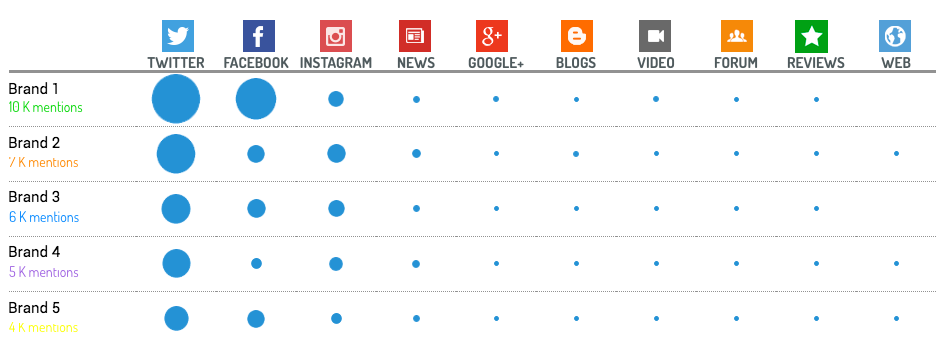 Social listening chart displaying the distribution of online chatter across different channels for each brand.
Pro Tip
Monitoring customer conversations by channel consistently over the year can help you to plan better strategies by capturing changing behaviours and habits of the community, and identifying new rising influencers. Depending on campaigns, customers’ conversations can move from one channel to another.
Bonus: Unlock your customers' opinions on social media! Find out how with this guide.
4. Influencers
Purpose
By identifying internauts who are expressing their opinions about your brand, including prospects, customers, and influencers, you can learn more about their sociodemographic characteristics and interests. With this, you can also highlight key potential segments, as well as your customers' expectations, trending interests, and favorite channels to focus your marketing efforts on.
What to Include?
These graphs should show influencers (including celebrities and macro and micro influencers), media and brands in terms of engagement, relevance and authenticity. Further analysis would also require these group of influencers to be defined by channel, brand, and theme.
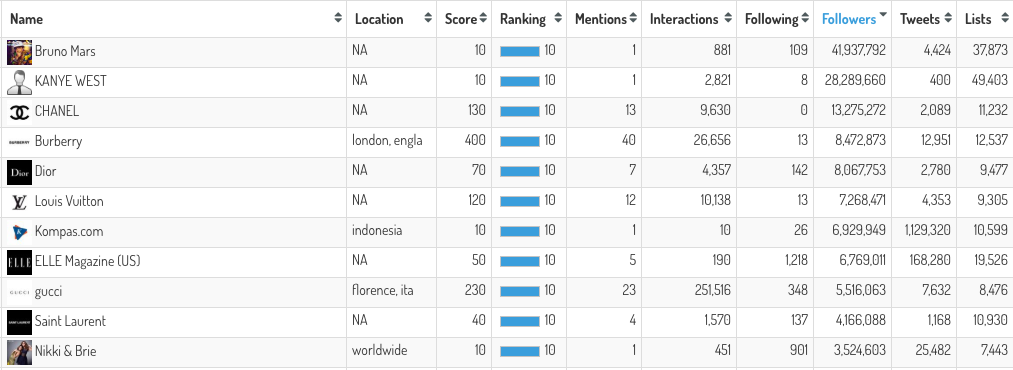 Social listening chart displaying celebrities and brands leading online discussions and generating the most engagements in the luxury industry on Twitter.
Pro Tip
To accurately reach your targeted communities, it is useful to identify the socio-demographic profile of influencers in terms of:
- Sex and age
- Profession
- Hobbies and interests
After having analyzed earned media through conversations from consumers and media around your brand, the next step is to analyze the performance of your brand's social media accounts.
Owned Media
5. Interactions on Your Brand's Social Accounts
Purpose
The objective of measuring owned media is to gain insights on the performance of your brand's social media activity in terms of:
- Which channel has more reach or engagement (Facebook vs Instagram)
- Your competitors, or the leading players in your industry
What to Include?
Beyond measuring the volume of interactions in your brand’s social community, it is important to look into the performance of your social accounts by the type of interactions. This is because the volume of interactions in your community may be inert or passive, and may not necessarily be relevant indicators to the success of your campaigns. Relevant indicators would include likes, favourites, retweets, shares, reposts and comments, etc.
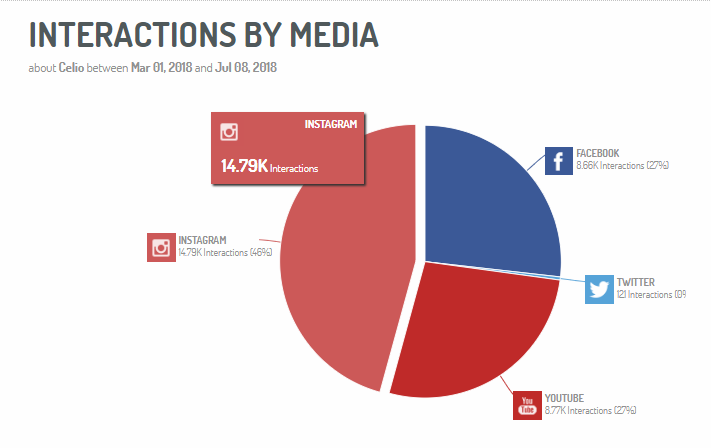 Social listening chart displaying the distribution of engagements across a brand's social media channels. Here, Instagram has outperformed Facebook and Twitter.
Pro Tip
Reviewing the performance of your social accounts is useful for benchmarking your brand against competitors, and understand what engages consumers. Do this by measuring the number of interactions among your top competitors and identifying what type of posts generate the most engagement. This will allow you to better position your brand, and make informed business decisions with confidence.
In Summary
Data visualization is a powerful tool for helping marketers make sense of the myriad data collected from social media. Every social media listening dashboard should be uniquely tailored to your team's specific needs, while enabling you to digest information and make decisions with greater dexterity.
To find out how you can build and customize your own social listening dashboard, book a free consultation with our social listening experts!