The other day I was talking with the Social Media Manager of a company in the airline industry. He was lucky to have a Social Monitoring tool to listen to conversations about his company, its brand (earned media), measure the performance of its statutory accounts (owned media) and their search engine reputation (SE Reputation). But he still had questions about how to develop an "online reputation dashboard" (or Social Media Dashboard) which must provide different services.
He has to deliver weekly reports to his digital marketing boss and bi-monthly reports with 3 founders. But he wants to make more efficient dynamic dashboards for 2 main reasons:
- "I want to extract PDF reports or PowerPoints directly from my dashboards"
- "I want to be able to create personalized dashboards for 6 different targets within the company: Management Committee, Customer Support, Digital Marketing, Risk Management, Communications and Intelligence managers who all have very specific needs".
"How can I achieve effective, synthetic dashboards (especially for the Management Committee who want to get straight to the essential points), that are also adaptable over time depending on changing needs and environment?"
Let's see how we can respond to these essential questions for managing Social Media activity.
I. The Rules for Creating Your Dashboard
What Are the Needs of Your Internal Clients?
This is a must: to develop the first version of your dashboard, you should carry out an audit on your internal customers to reveal their needs and ways of working to know how to fully effectuate their reporting needs.
To be clear, especially for trades not specializing in Social Media Monitoring and Social Media Intelligence, it's a good idea to show your clients version 0 (a draft dashboard) so they can visualize the possibilities and principles of a dynamic dashboard: the view of conversation messages and articles, technical analysis, quantitative performance indicators, variables and Analytics (performance of social accounts managed by the brand), etc.
The questions you should be asking can be articulated as follows:
- What are the Key Performance Indicators (KPIs) you should be using to measure your activity: are they directly related to Social Media intelligence? Example: the growth of positive feelings concerning a given customer service.
- What do you want to know? The types of messages, or to visualize volume? Are you only interested in certain products or channels?
- How much time can you devote to reading and using this dashboard every week?
- Are you familiar with these Social Media Intelligence tools; another question correlating may be: Would you be able to access the dashboard to change the settings if necessary?
- Do you have your own internal clients to whom you distribute all or part of this dashboard too?
- Do you have any potential specific needs: monitoring a campaign's impact, crisis management, product launch?
- How is your department organized? (This may impact the dashboard presentation: a Market Intelligence department might organize by Products, Location, account type, etc. These criteria and reading grids must be put into the dashboard in the same way.
What Type of Presentation Should I Choose?
It should match your internal customers: how they work, their analysis patterns, and reporting. The chosen topics and indicators should correspond to the business' organization and retrieval of service data: the dashboard can be shared and will be the origin of other deliverables produced by your internal customers (Reports, PowerPoints).
If it is a geographical organization that is most prominent in your business and/or in the service concerned, it is this criterion that should be the dashboard entry point. If these points cross over (ie. Regions x products), the dashboard will use views that combine the different types of data.
 Create your Social Media Dashboard
Which Data Retrieval Logic Should I Use?
Like any dashboard, the data retrieval logic can follow different philosophies:
a. Dashboard organized according to your processes
Example for a digital marketing service: the 5 phases of the "marketing funnel":
Brand Awareness > Customer Acquisition > Engagement > Customer Satisfaction > Lead Conversion
Thus, the Social Media Dashboard may include as many windows or tabs as phases of the "marketing funnel". You can then, within each view showing the phases, view your product data, markets, and web media types for example.
b. Dashboard organized by Web/Social Media channels
This presentation is divided by channel: Media, Facebook, Blogs, Instagram, Twitter, Pinterest ... For more clarity and if your activity covers all these areas, it is interesting to distinguish within your dashboard, the Earned media, and Owned media.
Again, you can define such data by period (weekly, bi-monthly, or dates of specific campaigns) and customize views by region and product.
c. Dashboard organized by mark/region
This type of dashboard is organized according to your geographical zones or products.
Synthetic and detailed. Keep in mind that the dashboard must be operational: it is tempting to want to accumulate as much data and indicators as possible, so you don't "miss anything". Also, for more ease, always allow for 2 views: the synthetic view that presents the bare essentials - the three views that are key to your daily activity (eg data that can quickly and/or heavily impact figures for your business) and a detailed view displaying all relevant data for further analysis.
II. 10 Types of Online Reputation Dashboards for Your Boss
After having read the rules for developing your Social Media dashboard according to the needs of your internal customers, we will look at different types of useful dashboards to manage your brand reputation as a whole (image, customer experience, consumer reviews, competitor insights, etc.).
That does not mean creating a list of all possible dashboard types, as you will end up with an array of dashboards to juggle with. Nevertheless, to kick-start the creative process, we'll examine some models that can guide you in the right direction.
Before, a Social Media Manager suggested using a simple PowerPoint ™ model to present to his internal customers (top recipients and Marketing users, General Management, Customer service...) who have the ability to easily change the way the dashboard is organized according to what they want or need. Tip: Your Social Media tool should allow you to modify the organization and dashboard content at any time, to make sure it adapts to changing internal and market needs (new media, new players).
Of course, the final dashboard will be customized to the specific team needs. There are several major types of social media dashboards specific to market concerns, competitive intelligence, and various significant indicators (see Social Media KPIs here). Here is a list (non-exhaustive) of a few types of dashboards:
1. The Social Media Manager’s Steering Dashboard
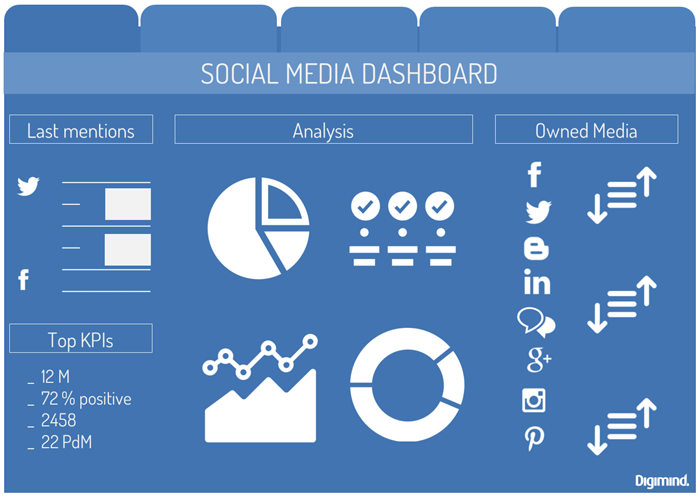
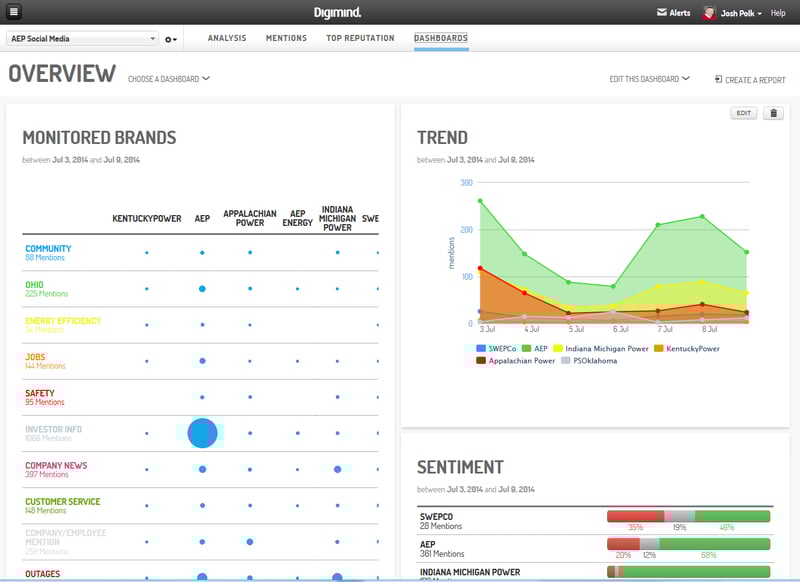
Very comprehensive, it has a view that breaks down KPIs into Owned and Earned Media, the latest mentions filtered by theme and channel (news, blogs, Twitter, Instagram, etc.), analysis by concepts (what's being talked about), product and competitor Share of Voice, by period (conversation peak), by influencers, by web media, and by sentiment.
Everything can (should) be supplemented by dynamic benchmarks including the main competitors and for all data types. If you manage your company's accounts for specific brands, the dashboard should also include performance indicators (communities, interaction, most shared publications) from your Twitter, Pinterest, YouTube, Instagram, Linkedin, Facebook, and your blogs, etc.
 Use a dashboard model to exchange with your internal clients.
2. The 'Influencer Marketing' Dashboard
It is used to control the detection and management of your influencers and ambassadors organized by brands or markets. It presents dynamic lists of "influencers" that can be sorted according to your selected influencer marketing indicator: reach, authority, relevance, impact, etc.
It also displays the influencer communities, their relationship with your brand, positioning (audience vs expertise), and their audience demographic.
3. The 'Crisis Management' Dashboard
This is a pre-configured dashboard with views that will inevitably be needed during an emerging crisis impacting Social Media in any way: monitoring online discussion, media articles, alert thresholds. Of course, it must be adaptable to be able to include future crisis specific that may arise (keyword phrases, adding specific sources, opinion leaders, etc.).
4. The 'Campaign Tracking' Dashboard
This dashboard allows you to monitor the impact of a campaign, whether it is offline or online (conversations, interaction, development, hashtags, sentiment, etc.). It must show the impact evolution by volume, per week or hours, providing channel targeting (Twitter, Facebook, blogs, press) and geographic regions/cities.
5. The 'Competitor' Dashboard
A "classic": this dashboard tracks the conversations mentioning your competitors, their reputation in search engines, their press coverage, their influencers, their favorite channels, but also the performance of their accounts which they manage themselves. The ideal dashboard presents all data systematically, showing a comparative view with your own data. For example, the interaction rate on their tweets vs yours.
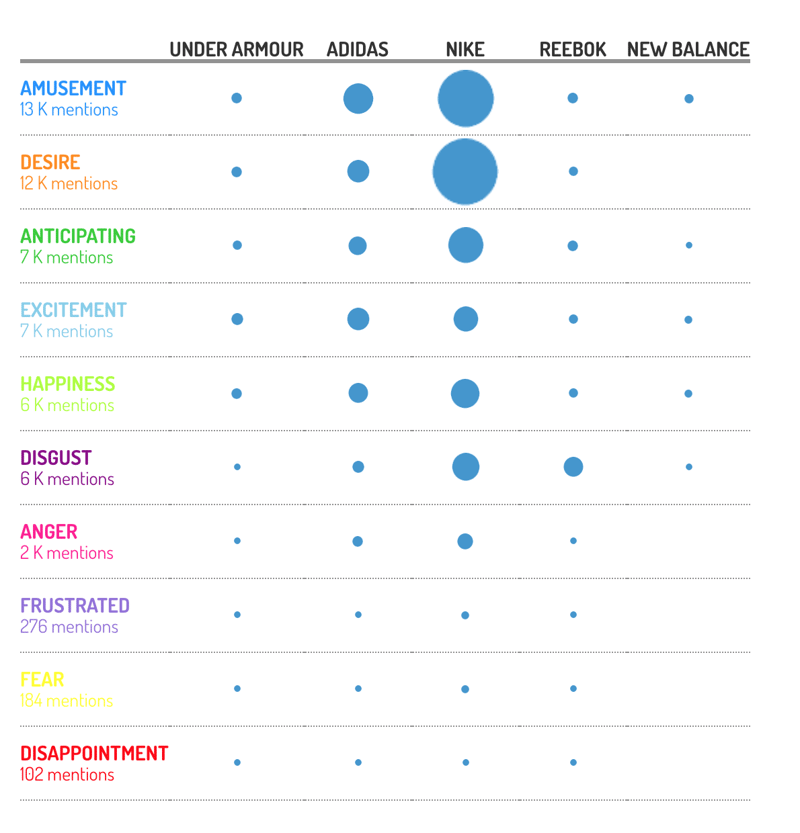
6. The 'Trend Analysis' Dashboard
Some departments (Market Intelligence, Strategy, and Insights) must operate competitive intelligence for strong or emerging trends, macro or micro. This dashboard can present a view of the most used hashtags, trending topics you're monitoring, competitive intelligence on studies coming from consultancy firms and institutes, as well as monitor developments in the 20 key trends in conversations on social media, etc.
7. The 'Customer Service Satisfaction' Dashboard
This is used to collect all data related to customer experience: customer Tweets about service, social networking messages which are then integrated into your customer support platform in the form of "support tickets", the evolution in customer satisfaction (sentiment, products, brands, etc.).
8. The 'Social Media Leads' Dashboard
This presents the monitoring of all the messages posted by online users concerning needs linked to your products and services or related to your market. Example: "I am looking for a white laptop, 17 inches, less than 550 euros", "What would you recommend between a Renault Clio, Polo, or 306?"
9. The 'Owned Media/Earned Media' Dashboard
This means arranging your dashboard by your social media feeds: produced by online users and journalists (conversations, posts, articles) or produced by your company (your blog, your social accounts).
Part of the dashboard will be devoted to the Earned Media displaying all conversations and publications coming from users who speak about your brand whilst on the other hand it will display the items produced by the media. A breakdown can then be done by channel (Facebook, Twitter, Blog, Instagram, news sites, etc.), or by product and market.
Another part will be Owned Media which will show the performance of your social networks (Twitter, Pinterest, Linkedin, Facebook, for example). Tip: to put all these feeds into perspective, keep space in your dashboard for at least one competitor intelligence column.
10. The 'Professional Monitoring' dashboard
This can act as, for example, innovation intelligence, for the product department. It is a type of dashboard which puts forward the conversation feed and articles that will be read or driven almost entirely by the CI practitioner. This goes beyond the more analytical approach centered on "metrics" (volume, commitment) of a Social Media Management dashboard for example.
This does not prevent the practitioner from injecting into the intelligence with a reading dimension linked with popularity (audience, shares) or more typically linked to relevance. This dashboard, for simplifying data access, generally displays DataViz tools to identify key concepts and "clusters" that link the concepts together.
And what about you, what sort of data is displayed on your dashboard?