.png?width=100&name=logo%20(1).png)

After having seen in our previous post the rules for developing your Social Media dashboard according to the needs of your internal customers, we will look at different types of useful dashboards to manage your brand reputation as a whole (image, customer experience, consumer reviews, competitor insights...).
That does not mean creating a list of all possible dashboard types, as you will end up with as many dashboards as you have focuses. Nevertheless, to kick-start the creative process, we'll examine some models that can guide you in the right direction.
Before, a Social Media Manager suggested using a simple PowerPoint ™ model to present to his internal customers (top recipients and Marketing users, General Management, Customer service...) who have the ability to easily change the way the dashboard is organized according to what they want or need. Tip: Your Social Media tool should allow you to modify the organization and dashboard content at any time, to make sure it adapts to changing internal and market needs (new media, new players).
Of course, the final dashboard will be customized to the specific team needs. There are several major types of social media dashboards specific to market concerns, competitive intelligence, and various significant indicators (see Social Media KPIs here). Here is a list (non-exhaustive) of a few types of dashboard:
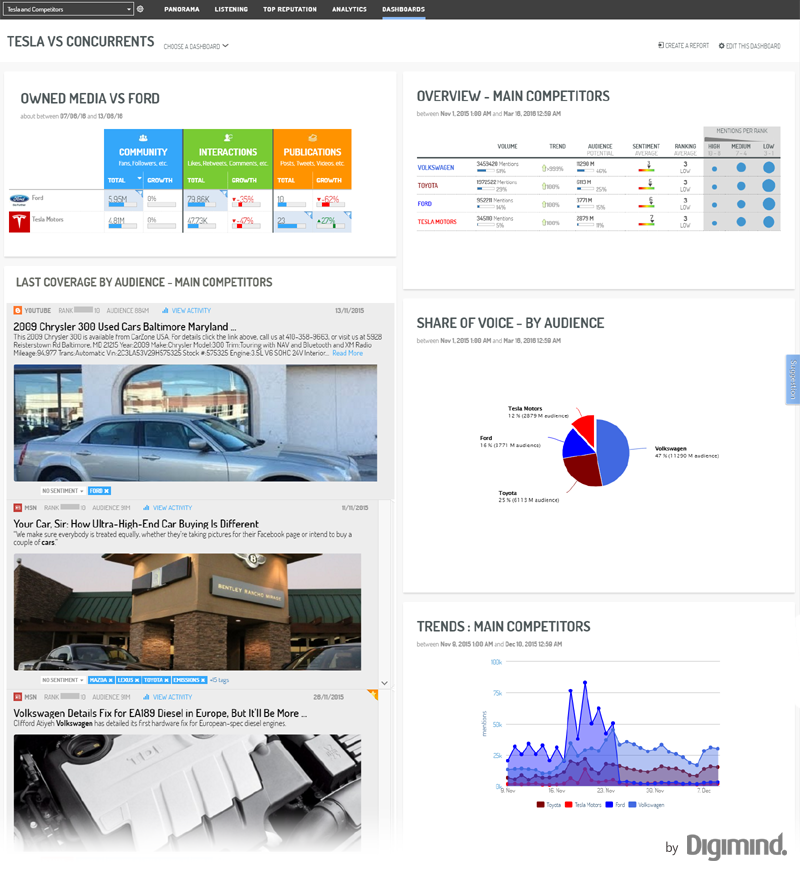
1. The Social Media Manager's steering dashboard
Very comprehensive, it has a view which breaks down KPIs into Owned and Earned Media, the latest mentions filtered by theme and channel (news, blogs, Twitter, Instagram ...), analysis by concepts (what's being talked about), product and competitor Share of Voice, by period (conversation peak), by influencers, by web media and by sentiment. Everything can (should) be supplemented by dynamic benchmarks including the main competitors and for all data types. If you manage your company's accounts for specific brands, the dashboard should also include performance indicators (communities, interaction, most shared publications) from your Twitter, Pinterest, YouTube, Instagram, Linkedin, Facebook and your blogs etc...
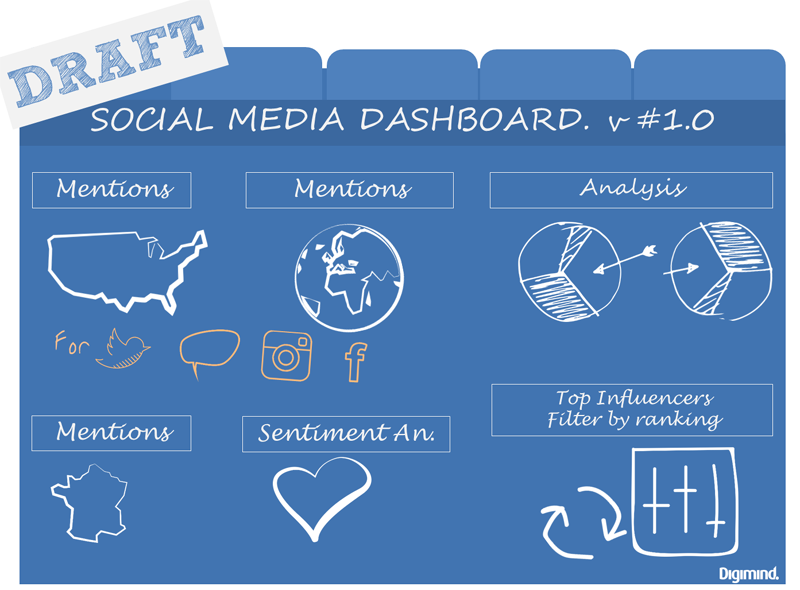 Use a dashboard model to exchange with your internal clients
2. The 'Influencer Marketing' dashboard
It is used to control the detection and management of your influencers and ambassadors organized by brands or markets. It presents dynamic lists of "influencers" that can be sorted according to your selected influencer marketing indicator: reach, authority, relevance, impact... It also displays the influencer communities, their relationship with your brand, positioning (audience vs expertise) and their demographic.
3. The 'Crisis Management' dashboard
This is a pre-configured dashboard with views that will inevitably be needed during an emerging crisis impacting Social Media in any way: monitoring online discussion, media articles, alert thresholds. Of course, it must be adaptable to be able to include future crisis specific that may arise (keyword phrases, adding specific sources, opinion leaders ...).
4. The 'Campaign Tracking' dashboard
This dashboard allows you to monitor the impact of a campaign, whether it is offline or online (conversations, interaction, development, hashtags, sentiment...). It must show the impact evolution by volume, per week or hours, providing channel targeting (Twitter, Facebook, blogs, press) and geographic regions / cities.
5. The 'Competitor' dashboard
A "classic": this dashboard tracks the conversations mentioning your competitors, their reputation in search engines, their press coverage, their influencers, their favorite channels, but also the performance of their accounts which they manage themselves. The ideal dashboard presents all data systematically, showing a comparative view with your own data. For example, the interaction rate on their tweets vs yours.
6. The 'Trend Analysis' dashboard
Some departments (Market Intelligence, Strategy and Insights) must operate competitive intelligence for strong or emerging trends, macro or micro. This dashboard can present a view of the most used hashtags, trending topics you're monitoring, competitive intelligence on studies coming from consultancy firms and institutes, as well as monitor developments in the 20 key trends in conversations on social media etc...
7. The 'Customer Service Satisfaction' dashboard
This is used to collect all data related to customer experience: customer Tweets about service, social networking messages which are then integrated into your customer support platform in the form of "support tickets", the evolution in customer satisfaction (sentiment, products, brands ...).
8. The 'Social Media Leads' dashboard
This presents the view monitoring all the messages posted by online users concerning needs linked to your products and services or related to your market. Example: "I am looking for a white laptop, 17 inches, less than 550 euros", "What would you recommend between a Renault Clio, Polo or 306?"
9. The Owned Media/Earned Media dashboard
This means arranging your dashboard by your social media feeds: produced by online users and journalists (conversations, posts, articles) or produced by your company (your blog, your social accounts).
Part of the dashboard will be devoted to the Earned Media displaying all conversations and publications coming from users who speak about your brand whilst on the other hand it will display the items produced by the media. A breakdown can then be done by channel (Facebook, Twitter, Blog, Instagram, news sites...) or by product and market.
Another part will be Owned Media which will show the performance of your social networks (Twitter, Pinterest, Linkedin, Facebook, for example).
Tip: to put all these feeds into perspective, keep space in your dashboard for at least one competitor intelligence column.
10. The 'Professional Monitoring' dashboard
This can act as, for example, innovation intelligence, for the product department. It is a type of dashboard which puts forward the conversation feed and articles that will be read or driven almost entirely by the CI practitioner. This goes beyond the more analytical approach centered on "metrics" (volume, commitment) of a Social Media Management dashboard for example.
This does not prevent the practitioner from injecting into the intelligence with a reading dimension linked with popularity (audience, shares) or more typically linked to relevance. This dashboard, for simplifying data access, generally displays DataViz tools to identify key concepts and "clusters" that link the concepts together.
In our next post, we'll see what sections and data you can incorporate into your online reputation dashboard.